ESG Library
Social
Health and Safety
Work-Related Accidents
Change in the Frequency Rate of Accidents at Work
| Classification | FY2018 | FY2019 | FY2020 | FY2021 | FY2022 |
|---|---|---|---|---|---|
| DOWA Group | 2.56 | 1.23 | 1.03 | 1.02 | 1.19 |
| Same-sized business site average* | 1.20 | 1.20 | 1.21 | 1.31 | 1.25 |
*Ministry of Health, Labour and Welfare statistics for manufacturing industries with 100 or more employees
Change in the Severity Rate of Accidents at Work
| Classification | FY2018 | FY2019 | FY2020 | FY2021 | FY2022 |
|---|---|---|---|---|---|
| DOWA Group | 0.32 | 0.01 | 0.27 | 0.01 | 0.87 |
| Same-sized business site average* | 0.10 | 0.10 | 0.07 | 0.06 | 0.08 |
*Ministry of Health, Labour and Welfare statistics for manufacturing industries with 100 or more employees
Note : Cooperating companies and contractors have not been included when calculating these figures. Totals have been calculated for accidents requiring one or more days of leave.
Frequency rate: Indicator showing the frequency of accidents by the number of dead and injured people due to accidents at work per one million total working hours
Severity rate: Indicator showing the degree of accident severity by the number of working days lost per 1,000 total working hours
Work-Related Accidents (Number of Deaths)
(Unit : People)
| Classification | FY2018 | FY2019 | FY2020 | FY2021 | FY2022 |
|---|---|---|---|---|---|
| Permanent employees | 0 | 0 | 0 | 0 | 2 |
| Non-permanent employees | 0 | 0 | 0 | 0 | 0 |
| In-plant contract workers | 0 | 0 | 0 | 0 | 1 |
| Total | 0 | 0 | 0 | 0 | 3 |
Status of Health and Safety-Related Training Programmes
(Unit : People)
| Training Program | Classification | Target Participants | FY2022 |
|---|---|---|---|
| Seminar to Improve Understanding of Occupational Health and Safety (intermediate) | Training on safety | Managers | 78 |
| RA Assessor Training | Training on safety | Risk assessment assessors | 294 |
| Training on the Illegal Assessment of Occupational Health and Safety (intermediate) | Training on safety | Safety and environmental supervisors | 26 |
| Compliance seminars | Safety-related general training | Safety and environmental supervisors | 14 |
Employment
Status of Employees
Number of Employees by Region
(Unit : People)
| Region | FY2018 | FY2019 | FY2020 | FY2021 | FY2022 | |||
|---|---|---|---|---|---|---|---|---|
| Men | Women | Men | Women | |||||
| Japan | 6,359 | 6,491 | 6,810 | 5,566 | 1,234 | 5,792 | 1,376 | |
| Overseas | Asia (except Japan) | 3,148 | 3,217 | 3,558 | 3,105 | 503 | 3,218 | 535 |
| Europe | 25 | 28 | 29 | 30 | 15 | 21 | 16 | |
| North America | 166 | 128 | 128 | 99 | 27 | 112 | 36 | |
| Latin America | 62 | 84 | 76 | 52 | 28 | 50 | 32 | |
| Overseas subtotal | 3,401 | 3,457 | 3,791 | 3,286 | 573 | 3,401 | 619 | |
| Total | 9,760 | 9,948 | 10,601 | 8,852 | 1,807 | 9,193 | 1,995 | |
| Grand total | 9,760 | 9,948 | 10,601 | 10,659 | 11,188 | |||
Note : Including Non-Consolidated
Number of Domestic Employees by Age Group
(Unit : People)
| Age | FY2022 | |||||||||||
|---|---|---|---|---|---|---|---|---|---|---|---|---|
| Permanent Employees | Non-Permanent Employees | |||||||||||
| Executive Officers | Management Employees | General Employees | Outsourced and Temporary Employees | Part-Time Employees | Dispatch Employees | |||||||
| Men | Women | Men | Women | Men | Women | Men | Women | Men | Women | Men | Women | |
| Under 30 | 0 | 0 | 0 | 0 | 822 | 150 | 26 | 10 | 33 | 19 | 881 | |
| 30–49 | 0 | 0 | 393 | 17 | 2,110 | 288 | 73 | 54 | 76 | 100 | ||
| Over 50 | 86 | 1 | 429 | 4 | 669 | 125 | 375 | 60 | 159 | 103 | ||
| Subtotal | 86 | 1 | 822 | 21 | 3,601 | 563 | 474 | 124 | 268 | 222 | 881 | |
| Total | 5,094 | 1,969 | ||||||||||
| Grand total | 7,063 | |||||||||||
Number of Overseas Employees by Age Group
(Unit : People)
| Age | FY2022 | |||||
|---|---|---|---|---|---|---|
| Resident Employees | Local Employees (Permanent Employees) |
Local Employees (Non-Permanent Employees) |
||||
| Men | Women | Men | Women | Men | Women | |
| Under 30 | 3 | 0 | 324 | 119 | 601 | 33 |
| 30–49 | 67 | 6 | 1,370 | 364 | 608 | 44 |
| Over 50 | 41 | 1 | 304 | 37 | 83 | 15 |
| Subtotal | 111 | 7 | 1,998 | 520 | 1,292 | 92 |
| Total | 118 | 2,518 | 1,384 | |||
| Grand total | 4,020 | |||||
Labor and Diversity
Establishing Diverse Workstyles
Status of Leave Taken in Relation to Childcare and Family Care Leave
(Unit : People)
| FY2018 | FY2019 | FY2020 | FY2021 | FY2022 | |||||||
|---|---|---|---|---|---|---|---|---|---|---|---|
| Men | Women | Men | Women | Men | Women | Men | Women | Men | Women | ||
| Childcare leave (*) | Number of acquirer | 2 | 31 | 0 | 22 | 5 | 33 | 13 | 20 | 40 | 17 |
| Number of eligible persons | 125 | 13 | 131 | 10 | 150 | 16 | |||||
| Number of employees who took leave to care for sick children | 35 | 28 | 64 | 24 | 76 | 27 | 116 | 46 | 36 | 9 | |
| Number of employees who took leave to provide nursing care | 11 | 5 | 22 | 12 | 35 | 15 | 11 | 13 | |||
*Number of persons on childcare leave includes the number of persons who were continuously on childcare leave from the previous year. The number of eligible persons is the number of persons who were newly eligible in the relevant year.
Number of Employees Taking Childcare Leave and Leave to Care for Sick Children
| FY2020 | FY2021 | FY2022 | ||||
|---|---|---|---|---|---|---|
| Men | Women | Men | Women | Men | Women | |
| Retired employees on childcare leave (People) | 0 | 0 | ||||
| Persons returning to work after childcare leave (People) | 3 | 10 | 11 | 15 | 147 | 50 |
| Percentage of employees returning to work after childcare leave (%) | 100 | 100 | ||||
| Persons who have returned to work after an established childcare leave (persons)* | 0 | 11 | 4 | 12 | 30 | 11 |
| Percentage of retention after childcare leave (%)* | 100 | 95 | ||||
*Employees enrolled at the end of 12 months after returning to work from childcare leave.
Average Overtime Hours
(Unit : Hours/month)
| FY2018 | FY2019 | FY2020 | FY2021 | FY2022 | |
|---|---|---|---|---|---|
| Average hours of overtime work | 18.2 | 19.0 | 15.7 | 21.0 | 13.9 |
Status regarding the Taking of Annual Paid Leave
| FY2018 | FY2019 | FY2020 | FY2021 | FY2022 | |
|---|---|---|---|---|---|
| Average number of days granted (days) | 20 | 20 | 20 | 19 | 20 |
| Average number of days taken (days) | 14 | 15 | 14 | 15 | 16 |
| Ratio of leave taken (%) | 70.0 | 74.7 | 70.8 | 76.7 | 79.5 |
| Number of employees who took refresh leave (people) | 257 | 339 | |||
| Average number of volunteer leave days taken (days) | 0 | 0 |
Promoting Diversity and Spreading Awareness of Human Rights
Percentage of Female Employees by Job Classification
(Unit : %)
| Position | FY2018 | FY2019 | FY2020 | FY2021 | FY2022 |
|---|---|---|---|---|---|
| Executive officers | 0.8 | 0.9 | 0.9 | 0.9 | 1.1 |
| Management employees | 1.7 | 1.4 | 2.4 | 2.3 | 2.5 |
| General employees | 10.5 | 11.2 | 11.4 | 16.8 | 17.3 |
*HD-registered employees (including those of unconsolidated companies)
Training to Promote the Diversity of Human Resources
| Training Program | Target Participants | FY2017-FY2022 | |
|---|---|---|---|
| Total Time (Hours) | Total Attendance Rate (%) | ||
| Diversity and career training | Female employees | 218 | 42 |
| Diversity management training | Management employees | 80 | 35 |
Trend in Rehiring of Retirement
(Unit : People)
| FY2018 | FY2019 | FY2020 | FY2021 | FY2022 | ||||||
|---|---|---|---|---|---|---|---|---|---|---|
| Men | Women | Men | Women | Men | Women | Men | Women | Men | Women | |
| Employees leaving the workforce due to retirement | 71 | 11 | 87 | 7 | ||||||
| Rehiring of retirees | 46 | 2 | 55 | 2 | 40 | 2 | 61 | 10 | 31 | 4 |
Trend in Employment of People with Disabilities
(Unit : %)
| FY2018 | FY2019 | FY2020 | FY2021 | FY2022 | ||||||
|---|---|---|---|---|---|---|---|---|---|---|
| HD Only | Group-wide | HD Only | Group-wide | HD Only | Group-wide | HD Only | Group-wide | HD Only | Group-wide | |
| Percentage of employment of people with disabilities | 1.6 | 1.3 | 2.0 | 1.4 | 2.1 | 1.4 | 2.6 | 1.4 | 2.7 | 1.5 |
Human Resource Development
Securing Human Resources and Developing Core Human Resources
Status of Employment
| FY2022 | |||
|---|---|---|---|
| Men | Women | Total | |
| Average age (years old) | 41 | 39 | 41 |
| Average length of employment (years) | 14 | 11 | 13 |
| Number of employees hired (people) | 105 | 18 | 123 |
| Number of mid-career employees (people) | 130 | 19 | 149 |
| Number of employees who left for personal reasons (people) | 313 | 29 | 342 |
| Percentage of employees who left for personal reasons (%) | 6.7 | ||
| Average retention rate after 10 years of employment (%)* | 75 | 69 | |
*Calculation within the scope of new graduate recruitment in HD
Percentage of Mid-Career Recruits
(Unit : %)
| FY2019 | FY2020 | FY2021 | FY2022 | |
|---|---|---|---|---|
| Percentage of permanent mid-career hires* | 11 | 10 | 9 | 7 |
*Calculations based on the Law on Comprehensive Promotion of Labour Policies.
Turnover of New Hires Within Three Years of Joining the Company
(Unit : %)
| FY2020 | FY2021 | FY2022 | |
|---|---|---|---|
| Year of entry to the company | FY2018 | FY2019 | FY2020 |
| Turnover rate within 3 years of employment* | 6.4 | 5.7 | 15.2 |
*Calculation within the scope of new graduate recruitment in HD
Developing Human Resources and Promoting Organization-Building That Will Create Change
Status of Training System
| Content | Target Participants | FY2022 | ||
|---|---|---|---|---|
| Number of Participants (People) | Total Time (Hours) | |||
| Position-based education and elective education | ||||
| Training to strengthen middle management | Management employees | 28 | 1,008 | |
| Management training, training to strengthen skills for leading subordinates | Management employees | 73 | 2,409 | |
| New employee training | New employees | 53 | 15,264 | |
| Follow-up training for new and young people | 1st–3rd year employees | 156 | 5,440 | |
| Training for on-the-job-training instructors | On-the-job-training instructors | 47 | 376 | |
| New recruiters training | New recruiters | 47 | 376 | |
| Field-specific training | ||||
| Language support | English-learning methodology seminar | New employees (pre-assignment training) | 53 | 53 |
| Global | Preparatory training for overseas assignments | Employees receiving new overseas assignments | 7 | 112 |
| Training for overseas base managers | Managers of overseas bases | 18 | 288 | |
| Human rights | Stress check training | All applicable persons | 32 | 64 |
| Organizational development | Meetings of staff members responsible for human resource development to improve on-site capabilities | Staff members responsible for human resource development at each base | 49 | 1,176 |
Status of Employee Education
| Item | FY2018 | FY2019 | FY2020 | FY2021 | FY2022 | |
|---|---|---|---|---|---|---|
| Annual education eligible people (people) | 4,437 | 4,622 | 4,805 | 5,082 | 5,220 | |
| Number of in-company participants | Number of participants (people) | 1,538 | 1,931 | 1,546 | 845 | 825 |
| Number of possible participants (people) | 1,291 | 1,411 | ||||
| Total hours of education (hours) | 42,092 | 44,724 | 30,207 | 33,276 | 31,347 | |
| Total hours of education per person (hours/person) | 27 | 23 | 20 | 39 | 38 | |
| Total hours of education per person (hours/person)* | 9 | 10 | 6 | 7 | 6 | |
| Total annual educational investment (Thousands of yen) | 93,083 | 114,576 | 71,838 | 109,592 | 138,572 | |
| Total annual educational investment excluding travel expenses (Thousands of yen) | 71,144 | 90,104 | 71,440 | 109,019 | 127,392 | |
| Total cost of education per person (Thousands of yen) | 61 | 59 | 46 | 130 | 168 | |
| Total cost of education per person (Thousands of yen)* | 21 | 25 | 15 | 22 | 27 | |
*Eligible people are among permanent employees
Quality Assurance
Status of Quality Management System Certification
(Unit : Locations)
| Certification | Domestic | Overseas |
|---|---|---|
| ISO9001/OHSAS | 25 | 13 |
| Total | 38 | |
Supply Chain Management
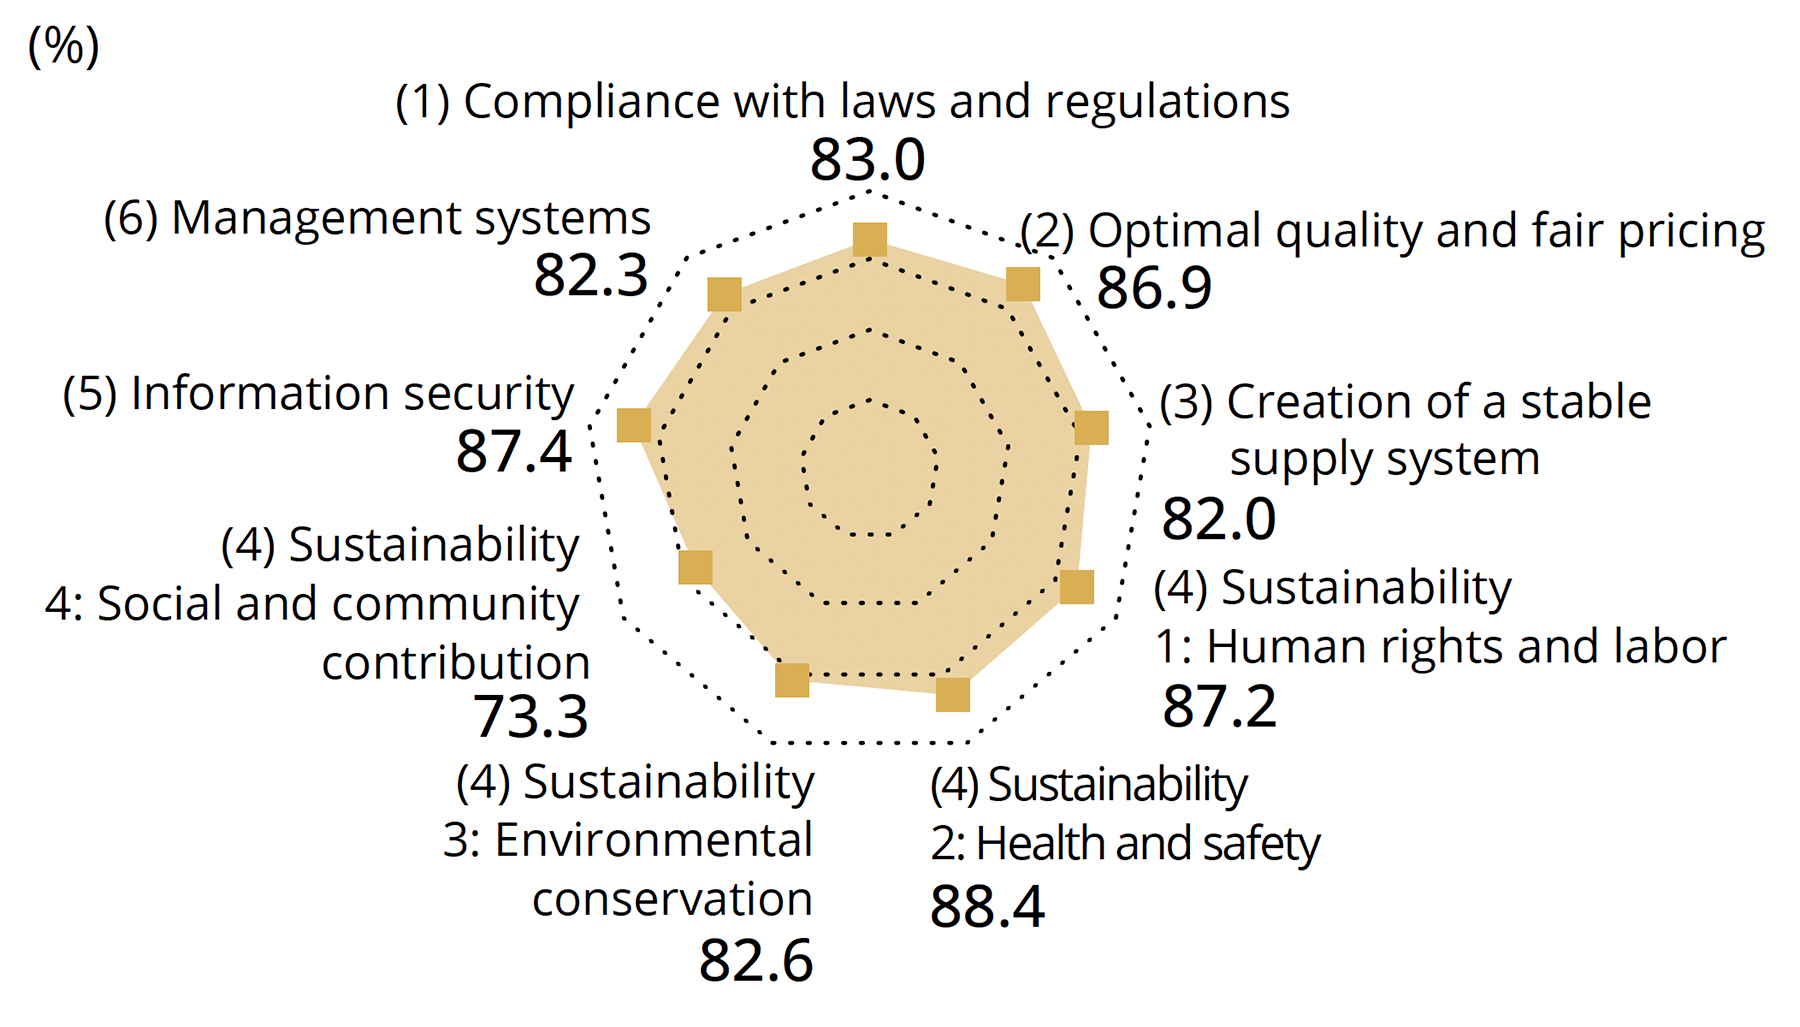
Self-Check Assessment Evaluation Results
(単位:%)
| FY2022 | |
|---|---|
| (1) Legal Compliance and Fair Trade | 83.0 |
| (2) Optimal Quality and Fair Price | 86.9 |
| (3) Establishing a Stable Supply System | 82.0 |
| (4) Sustainability 1) Human rights and labor | 87.2 |
| (4) Sustainability 2) Occupational health and safety | 88.4 |
| (4) Sustainability 3) Environmental conservation | 82.6 |
| (4) Sustainability 4) Contributions to society and local communities | 73.3 |
| (5) Information Protection | 87.4 |
| (6) Management System | 82.3 |
Human Rights
Status of Human Rights Education
| Training Program | Target Participants | FY2022 | |
|---|---|---|---|
| Number of Participants (People) | Total Time (Hours) | ||
| Training on Harassment | Managers | 67 | 134 |
Coexistence with Local Communities
Status of Support for the Development of the Next Generation
(Unit : Thousands of yen)
| Initiatives | FY2022 |
|---|---|
| Endowed chairs | 60,000 |
Status of Work Experience and Internships for Students
| Region | FY2022 | |
|---|---|---|
| Total Number of Participants (People) | Total Number of Days (Days) | |
| Domestic | 107 | 305 |
| Overseas | 41 | 930 |
Status of Community Support
(Unit : Thousands of yen)
| Region | Examples of Support | FY2022 |
|---|---|---|
| Japan |
– Donations for Nature Conservation – Provision of company housing for use by school-age children, etc. |
45,632 |
| Thailand |
– Scholarship Sponsorship – Donation of medical equipment, etc. |
1,257 |
| Indonesia |
– Support for local educational institutions – Contributions related to biodiversity, etc. |
8,196 |
| USA | – Sponsorship of local events, etc. | 583 |
| Total | 55,668 |