OUTPUT
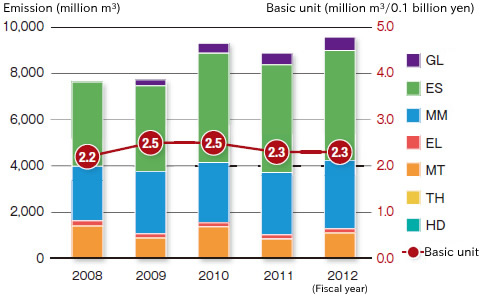
Total Emission of GHG
Total emission of GHG in 2012 was 1,490,000 tons (1,465,000 t in Japan and 25,000 t other countries) as converted to CO2, and emission of GHG in Japan increased by 9% compared to the previous year. The increase of grid emission factor affected the emission of GHG in Japan.
Our main efforts in 2012 are as stated below:
Measures to reduce the amount of emission
Promoting introduction of air-conditioning using gas heat pumps
Proper adjustment of air-conditioning and lighting systems
Proper adjustment of compressor pressures
Reduction of standby power when equipment and facilities are not operating
Reduction of heavy oil usage for reactivation of solvents
Measures for CO2 reduction from Transportation
Modal shift between Akita area and West Japan
Coordination and adjustment of scheduled truck deliveries through close communication and reduction of waiting time
Reduction of forklift operation by modifying layout inside our business establishments
Use of biodiesel for forklift operation within the premises
Efforts for Carbon Offset
Use of "carbon offset bonded uniforms and forklifts"
(contributed to reducing CO2 emission by approximately 9 tons)
< Changes of Annual Emission of Global Warming Gases
(Those derived from waste are only in Japan) >
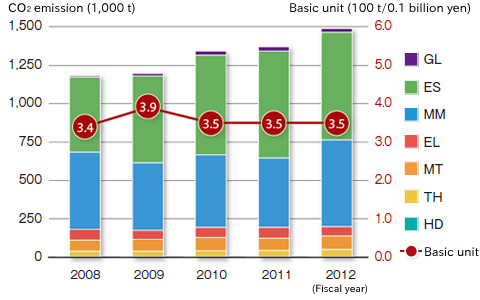
< Derived from Power + Fuel >
< Derived from Waste (in Japan only) >
Other emissions (Greenhouse gas)
The CO2 emission derived from GHG in 2012 was 20,150 kg–CO2. The emission is attributable to application of 16 kg of HFC-134a. Although this amounted to only 0.001% of the entire GHG emission of the DOWA group, we continue suitable management for global warming mitigation.
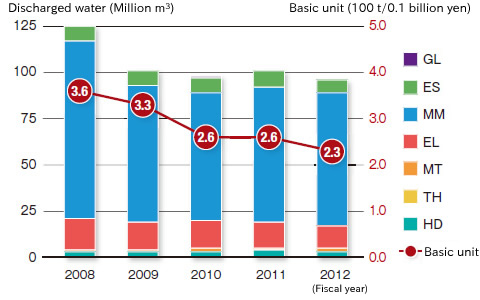
Total Discharged Water
Quantity of discharged water in 2012 was about 96 million m3 (96 million m3 in Japan and 0.2 million m3 other countries). The quantity of the discharged water across the entire group decreased by 5% from the previous year due to the decrease of water usage in our Nonferrous Materials business, which the major portion of our water usage.
< Changes of Annual Discharged Water >
Air and Water Pollution Loads
Air and water pollution loads of the DOWA group are greatly influenced by the composition of waste accepted by our Environmental & Recycling business. Each of our business establishments is committed to reducing these loads by enhancing their management system and setting forth its own standard that is stricter than governmental regulations
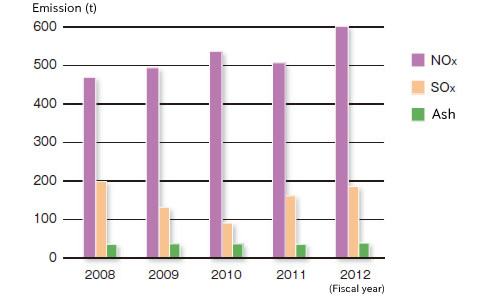
Exhaust gases
Emission of exhaust gases in 2012 was 9,576 million m3 (8,998 million m3 in Japan and 578 million m3 other countries) and the exhaust gas emission in Japan increased by 7% compared to the previous year.
Emission of nitrogen oxide (NOx) in Japan increased by 19%, sulfur oxide (SOx) by 18% and fly ash by 15% compared to the previous year. The increase of emission of those gases was all due to the increased operation.
< Changes of Emission of Exhaust Gases >
< Changes of Air Emission per Substance >
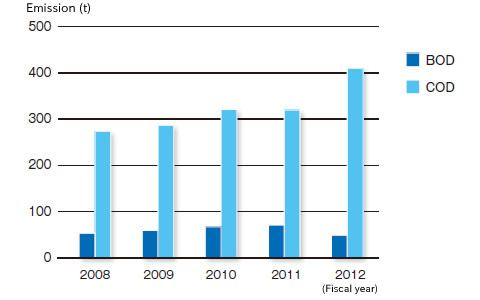
Water Quality
BOD (biochemical oxygen demand) decreased by 31% across the DOWA group compared to the previous year due to approximately 50% reduction in Kosaka Smelting & Refining. COD (chemical oxygen demand) decreased approximately 50% in DOWA ELECTONICS Okayama, while it increased by 67% in Akita Zinc compared to the previous year, resulting in 28% increase across the entire DOWA group.
< Changes of Waste Water Discharge into Water Area per Substance >
Quantity of Disposed and Transferred Chemical Substances
The DOWA group is committed to properly using and controlling chemical substances.
Main Reduction Measures
Recovery and reuse of chemical agents used in processes
Development of products that substitute for or that do not use hazardous substances
Unit: (g-TEQ for dioxine)
| Cabinet order No. | Name of Class I chemical substances | Discharged amount | Transferred amount | ||||
|---|---|---|---|---|---|---|---|
| Atmosphere | Water area | Soil | Landfill within our own property | Sewage system | Outside of each business | ||
| 1 | Water-soluble compounds of zinc | - | 4.1 | - | - | - | - |
| 31 | Antimony and its compounds | 0.12 | 0.28 | - | 72 | - | - |
| 44 | Indium and its compounds | - | - | - | - | - | 6.2 |
| 53 | Ethyl benzene | 0.03 | - | - | - | - | 2.9 |
| 72 | Ferric chloride | - | 0.004 | - | - | - | 5.8 |
| 75 | Cadmium and its compounds | - | 0.08 | - | 68 | - | 6.2 |
| 80 | Xylene | 0.03 | - | - | - | - | 3.1 |
| 82 | Silver and its water-soluble compounds | 0.01 | 0.03 | - | 4.6 | - | - |
| 87 | Chrome and trivalent chrome compounds | - | 0.06 | - | 130 | - | 1.9 |
| 132 | Cobalt and its compounds | - | - | - | - | - | 2.1 |
| 144 | Inorganic cyanogen compounds (excluding complex salt and cyanic acid) |
- | - | - | - | - | 0.003 |
| 242 | Selenium and its compounds | 0.01 | 0.2 | - | 5.8 | - | - |
| 243 | Dioxine | 0.13 | - | - | - | - | 34 |
| 258 | 1, 3, 5 and 7 - tetraazatricyclo [3.3.1.1.(3, 7)] decane |
- | - | - | - | - | 1,005 |
| 272 | Water-soluble salt of copper (excluding complex salts) | - | 1.1 | - | - | - | 5.0 |
| 304 | Lead | 0.23 | 0.06 | - | 1,300 | - | 44 |
| 305 | Lead compounds | - | - | - | - | - | 1,533 |
| 308 | Nickel | - | 0.01 | 68 | - | - | - |
| 309 | Nickel compounds | - | 1.2 | - | - | - | 0.42 |
| 332 | Arsenic and its inorganic compounds | 0.21 | 0.06 | - | 580 | - | 4.4 |
| 333 | Hydrazine | - | - | - | - | - | 2.4 |
| 374 | Hydrogen fluoride and its water-soluble salt | 0.16 | 35 | - | - | - | 0.83 |
| 405 | Boron compounds | - | 10 | 6.0 | - | - | 1.3 |
| 411 | Formaldehyde | - | 0.30 | - | - | - | - |
| 412 | Manganese and its compounds | - | 6.0 | - | - | - | 690 |
| 438 | Methylnaphthalene | 0.02 | - | - | - | - | - |
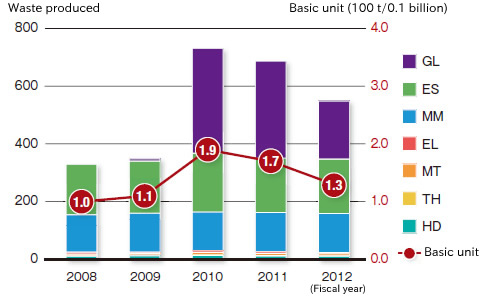
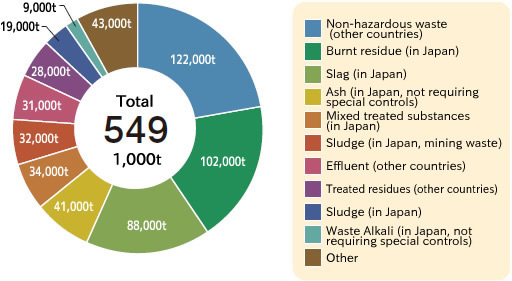
Waste Produced and Disposed and Recycling that Occurred
In 2012 total quantity of waste produced and recycling that occurred was 1,245,000 tons (1,030,000 t in Japan and 215,000 t other countries), of which 549,000 tons were disposed and 696,000 tons were recycled. Of the recycled waste 76,000 tons were valuable resources. The wasts produced and recycling that occurred in Japan decreased by 3% compared to the previous year mainly due to decrease of soil treatment.
Waste treated in and outside of the DOWA group combined with waste recycled outside of the group totaled to 727,000 tons (520,000 t in Japan and 207, 000 t other countries), of which waste recycled outside of the group was 179,000 tons. Waste and recycling disposed in Japan increased by 2% compared to the previous year. We had no waste that were subject to the Construction Waste Recycling Law of 2012.
Main Measures for Waste and Recycling
Conversion of used acid and used oil to valuable substances
Increased recovery of iron from accepted dust using massive electromagnets
Improved maneuverability at recycling by mixing calcium hydrate in residues
Our policies to reduce packaging materials in 2012
We optimize packaging method through wider use of large containers in order to reduce the use of packaging materials.
We make every effort to promote reusing of containers and packaging materials by utilizing used flexible containers and returnable containers.
We coordinate with our suppliers in order to collect containers smoothly.
< Changes of Annual Waste Produced >
< Details of Disposed waste >
[ About outsourced waste ]
In May 2012, effluent outsourced to an industrial waste disposal company by Dowa Hightech (DOWA’s subsidiary) was alleged to have been thrown into the Tone River System without proper treatment. We are sorry to have caused concern and anxiety to people around the affected area and relevant parties.
We organized a team to respond to the incident immediately after the incident was uncovered. We conducted full inspection of waste disposal across the group and we have endeavored to strengthen our management system.
An investigation of the Environmental Department of Saitama Prefecture found that Dowa Hightech did not violate the outsourcing standard on industrial waste disposal and we confirmed that Dowa Hightech did follow the procedures as stipulated by law regarding this incident.
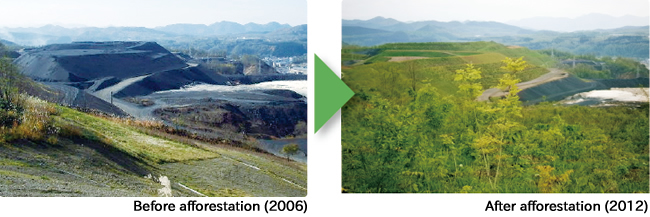
Conservation Status of Biodiversity
The mining, smelting and refining industries of Kosaka-machi, Akita Prefecture contributed to the economic development of the country and the local areas to a great extent. However, a wide range of forests were lost in the region as a result of deforestation during the excavation of mines and air pollution by smoke containing sulfurous acid gas due to smelting and refining. Afforestation in the area started in the Meiji Era and was dramatically boosted after three million trees, mainly locust trees were planted in 1950 in this area.
In 2006, the DOWA group determined to live in harmony with nature and started afforestation under the leadership of Honorary Professor Akira Miyawaki of Yokohama National University, who is the leading researcher in plant ecology. By planting trees native to the area, afforestation was started in area where ground was displaced by mining and mounds of tailings made up of residues from smelting and refining process of copper. By this method, based on the ecological survey on the area, a large variety of young trees native to the area were densely planted to form a forest of balanced vegetation that leads to diversity appropriate to the area through natural selection.
We have planted approximately 120,000 trees of various native species including firs, maples and beeches in cooperation with local inhabitants every year, and we will continue with our observation and survey of the growing process.

We conducted a vegetation management test to investigate germination of buried seeds and growth conditions. This forest management method is based on using nature's own mechanisms, aimed at nurturing a planted forest of cedars with a broad diversity of life. The DOWA group will strive to create forests with a wide variety of living creatures to make Kosaka area the region with admirable bio-diversity.